Air Quality Index Chart: The Six Bands, the Conversion Math Behind the Numbers, and What Each Band Should Make You Do

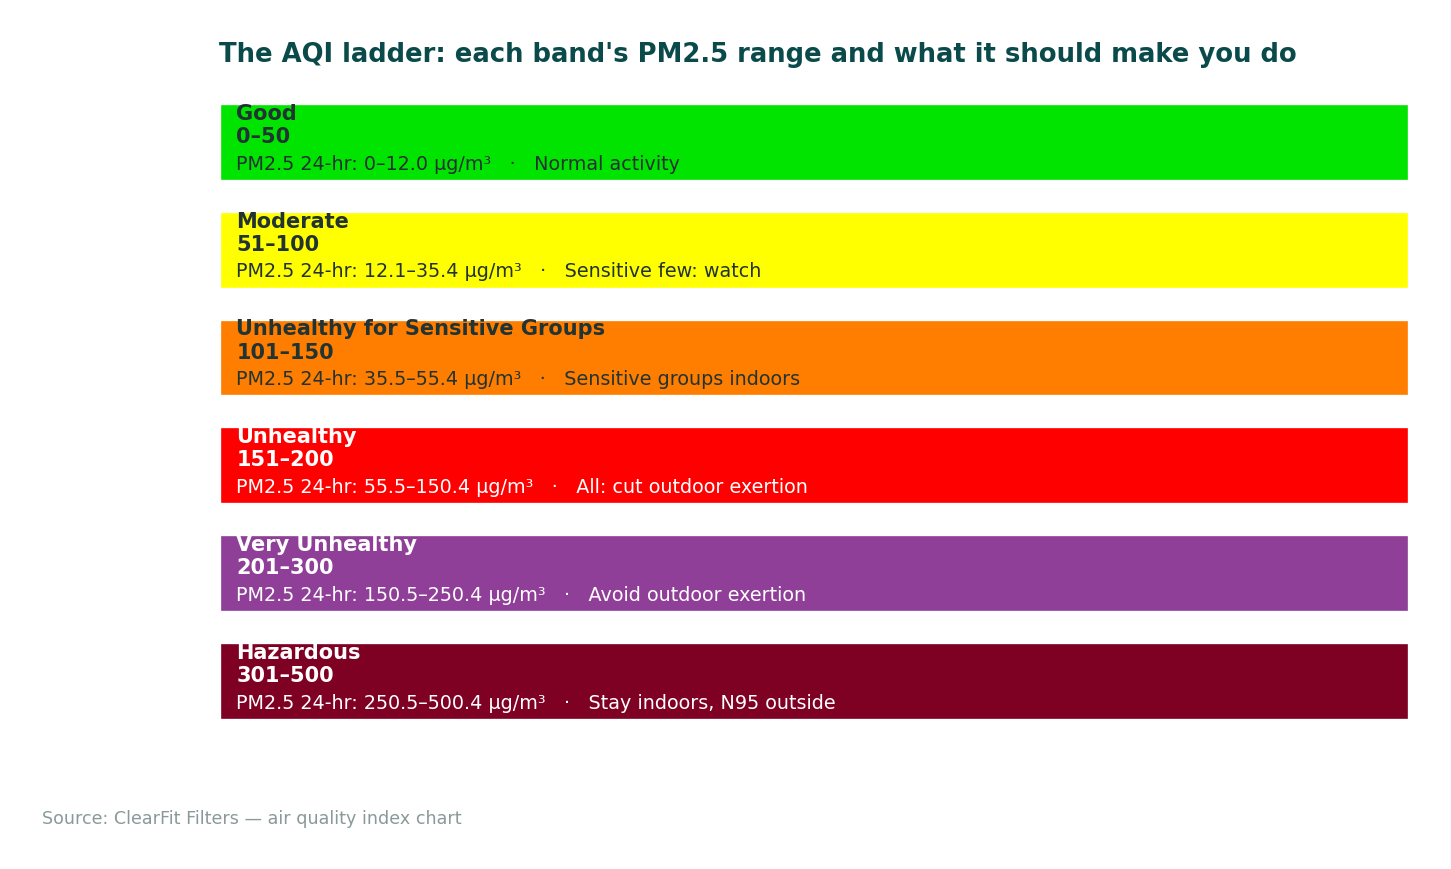
The AQI runs 0–500 in six color bands — Good (green) through Hazardous (maroon) — and it’s calculated per-pollutant, with the highest sub-index reported as “the” AQI. That last mechanism changes how you read the number: “AQI 150” isn’t a general smogginess score, it’s a specific pollutant (usually PM2.5) crossing its own 150-line first. This page is the chart itself — bands, breakpoints, the piecewise-linear math that converts a PM2.5 concentration into an index value, the EPA-versus-WHO standards gap, and the action column that makes the chart worth printing. For your city’s number right now, the live tool is at /air-quality/. Related: What Is AQI and How to Read It?.
Quick Answer: Bands: 0–50 Good (green), 51–100 Moderate (yellow), 101–150 Unhealthy for Sensitive Groups (orange), 151–200 Unhealthy (red), 201–300 Very Unhealthy (purple), 301–500 Hazardous (maroon). Key PM2.5 breakpoints (24-h): AQI 100 = 35.5 µg/m³; AQI 150 = 55.4; AQI 200 = 150.4. Below 100 = the regulatory “acceptable” line — but WHO’s annual guideline (5 µg/m³) sits far below the bottom of even the green band.
| AQI band | Color | PM2.5, 24-hr (µg/m³) | Meaning | Action |
|---|---|---|---|---|
| 0–50 Good | Green | 0–12.0 | Little or no risk | Normal activity |
| 51–100 Moderate | Yellow | 12.1–35.4 | Acceptable; unusually sensitive individuals take note | Usually fine; sensitive few reduce prolonged exertion |
| 101–150 Unhealthy for Sensitive Groups | Orange | 35.5–55.4 | Sensitive groups (children, 65+, asthma/heart, outdoor workers, pregnancy) affected | Sensitive groups move exertion indoors; check HVAC filter life |
| 151–200 Unhealthy | Red | 55.5–150.4 | Everyone affected; sensitive groups strongly | All: reduce outdoor exertion; run filtration; MERV 13 at next change |
| 201–300 Very Unhealthy | Purple | 150.5–250.4 | Health alert, everyone | Avoid outdoor exertion; clean-room protocol; portable HEPA |
| 301–500 Hazardous | Maroon | 250.5–500.4 | Health emergency | Stay indoors with filtration; masks (N95) outside; listen to officials |
(PM2.5 breakpoints per EPA’s AQI breakpoint table; ozone, PM10, CO, SO₂, NO₂ each have their own — the highest sub-index becomes the reported AQI.)
The reason a chart page needs a worked example, in one Reddit-observed paragraph: people see “AQI 97” on a weather app, see yellow, and think they’re fine — then see “AQI 103” the next day, orange, and think something broke. The jump is one data point in PM2.5: 97 sits at ~34 µg/m³, 103 at ~36. The band boundary is a regulatory cliff drawn through a continuum, and understanding the conversion (not just the color) is what lets you read “97” as “one microgram from orange” instead of “safely yellow.”
The Conversion Math: How µg/m³ Becomes AQI

The index uses piecewise-linear interpolation between breakpoints. For PM2.5 (24-h average), the Moderate band maps 12.1–35.4 µg/m³ to AQI 51–100:
I = (I_hi − I_lo)/(C_hi − C_lo) × (C − C_lo) + I_lo
Worked: a sensor reports C = 20.0 µg/m³. The band containing it is Moderate (C_lo=12.1, C_hi=35.4; I_lo=51, I_hi=100). So I = (49/23.3) × (20.0−12.1) + 51 = 2.102 × 7.9 + 51 ≈ 67 — mid-yellow. Now C = 36: that’s the orange band (35.5–55.4 → 101–150), I = (49/19.9) × (36−35.5) + 101 = 2.462 × 0.5 + 101 ≈ 102. The same +16 µg/m³ swing that moved 20→36 moved the index 67→102, crossing the line everyone acts on — the bands convert linear pollution into threshold behavior, for better and worse.
Two more conversions worth memorizing: AQI 100 sits at 35.5 µg/m³ (the “acceptable” ceiling — roughly seven times WHO’s annual guideline of 5) and AQI 150 at 55.4 (the everyone-affected line’s doorstep). When smoke-season reporting says “AQI 160,” you can invert: ~(160−151)/49 × 95 + 55.5 ≈ 72.9 µg/m³ of PM2.5 — the number a home sensor would roughly read.
ClearFit cuts the same 16x20x1 MERV 13 pleated media to OEM specifications – the 16x20x1 MERV 13 replacement filter, sized to confirm against your old filter before ordering.
EPA vs WHO: the Chart’s Second Column
The EPA bands are regulatory-implementation lines (balancing health science with attainability), not pure health lines. WHO’s 2021 air-quality guidelines put the annual PM2.5 target at 5 µg/m³ and the 24-hour at 15 µg/m³ — meaning a full “Good” green day (say, 10 µg/m³) still runs twice WHO’s daily line. This doesn’t make the chart useless; it makes it two charts: EPA’s for “what my regulator flags,” WHO’s for “what the health literature considers low.” Cities and apps increasingly show both; knowing the gap is why. The EPA’s own 2024 annual-standard tightening (12 → 9 µg/m³) moved the US line partway toward WHO’s and will reshape which counties count as “nonattainment” through this decade.
The Action Column: the Part Worth Printing
The chart’s utility is behavioral. Orange (101–150): sensitive groups shift exercise indoors, everyone else normal-but-aware — and the household move is checking HVAC filter remaining life (filtration only filters when air moves — the fan-circulation trick from purifier vs HVAC filter). Red (151–200): upgrade the next filter change to MERV 13 (the MERV 13 landing), set up a bedroom clean zone, run a portable HEPA if you own one. Purple/Maroon (201+): the clean-room protocol — sealed room, filtration, N95 outside — from the wildfire-smoke page. The alert system that tells you tomorrow’s band in advance is the AQI alert page.
Reading the Real-Time Number Without Being Fooled
Three chart-literacy notes. First, the reported AQI is a sub-index maximum — find which pollutant is driving it (apps show it; if PM2.5-driven, smoke/particles logic applies; if ozone-driven, the pattern is afternoon-peak and the mechanisms page explains the difference). Second, averaging windows differ: the official AQI uses 24-h PM2.5 averages (now-cast adjusted), while your consumer sensor shows minutes-to-hours — a sensor spike and an “official 80” can both be true. Third, purple-air-style maps run hotter than regulatory monitors (correction factors exist; treat consumer networks as relative, not absolute — the fuller treatment is on the indoor-testing page). For the number in your city now: the live AQI tool.
FAQ
What is a good air quality index level?
0–50, the green band — the regulatory “little or no risk” range. Health-literature fine print: even green sits above WHO’s annual guideline of 5 µg/m³ in much of the world; “good” means good by the index you’re reading, with the EPA/WHO gap explained above.
What is the no. 1 dirtiest country in the world?
By annual population-weighted PM2.5 (IQAir’s World Air Quality reports), the most-polluted countries list is consistently led by Bangladesh, Pakistan, and neighbors including Chad and India’s Delhi-region figures — Bangladesh topped the 2023 and 2024 rankings at ~80 µg/m³ annual average, roughly 16× WHO’s guideline. Country rankings shift year to year with monitoring coverage; the order of magnitude (many multiples of the guideline across South Asia and North Africa) is the stable fact.
Who has the worst air quality in the US right now?
It moves with the season: wildfire season puts Western and now Northern-tier cities (from Canadian smoke — see the mechanisms page) at the top of the daily lists; ozone season puts large Sun Belt metros (Los Angeles basin, Phoenix) in persistent summer exceedance. “Right now” is exactly what the live tool answers — any static list is yesterday’s smoke.
What is an unhealthy air quality index?
Officially, 151–200 is “Unhealthy” (everyone affected), and 101–150 is “Unhealthy for Sensitive Groups” — children, adults 65+, asthma or heart disease, outdoor workers, pregnancy. Practical reading: 101 is where behavior changes for sensitive households (indoor exercise, filtration check), 151 is where it changes for everyone.
Sources & References
- EPA — AQI technical assistance document: breakpoint tables and piecewise-linear equation; PM2.5 breakpoints (35.5/55.4/150.4 µg/m³ at AQI 100/150/200). Official documentation.
- WHO — 2021 Global Air Quality Guidelines — PM2.5 annual 5 µg/m³, 24-h 15 µg/m³. Official documentation.
- EPA — 2024 NAAQS PM2.5 annual standard revision (12 → 9 µg/m³). Official documentation.
- IQAir World Air Quality Report (2023–2024 editions) — country ranking methodology and results. Industry expert analysis.
Related Guides
- What Is AQI and How to Read It? — how the index is built.
- Why Is the Air Quality Bad Today? — what’s behind a bad reading.