What’s Really in Your Tap Water? The Three Layers, Typical Concentrations, and Where Each Number Comes From

US tap water contains three distinguishable layers, and both popular narratives about it — “it’s just water” and “it’s full of toxins” —flatten them into one. Layer one is deliberate: disinfectant residual (chlorine or chloramine held at ~0.2–4 mg/L to the tap) and, where communities opt in, fluoride at 0.7 mg/L. Layer two is incidental minerals from source geology: hardness (US median around 61 mg/L as CaCO₃, ranging from near-zero to 1,000+ in some aquifers), sodium, iron, manganese. Layer three is the regulated residuals: substances treatment reduces to legal-but-nonzero — lead (action level 15 µg/L at the 90th percentile), nitrate (MCL 10 mg/L), disinfection byproducts, and as of 2024, six PFAS compounds with limits of 4 ng/L. Every number in this paragraph is checkable in your own annual water quality report. Related: Is Tap Water Safe to Drink?.
Quick Answer: Three layers: intentional additives (fluoride 0.7 mg/L where added; chlorine/chloramine residual 0.2–4 mg/L), natural minerals (median US hardness ~61 mg/L as CaCO₃; sodium typically 20–100 mg/L), and trace residuals at legal-nonzero levels (lead: 15 µg/L 90th-percentile action level; nitrate MCL 10 mg/L; TTHM/HAA5 byproducts; PFAS MCLs of 4 ng/L since 2024). “Nothing in it” and “full of toxins” are both wrong — it’s a documented, regulated cocktail at known doses.
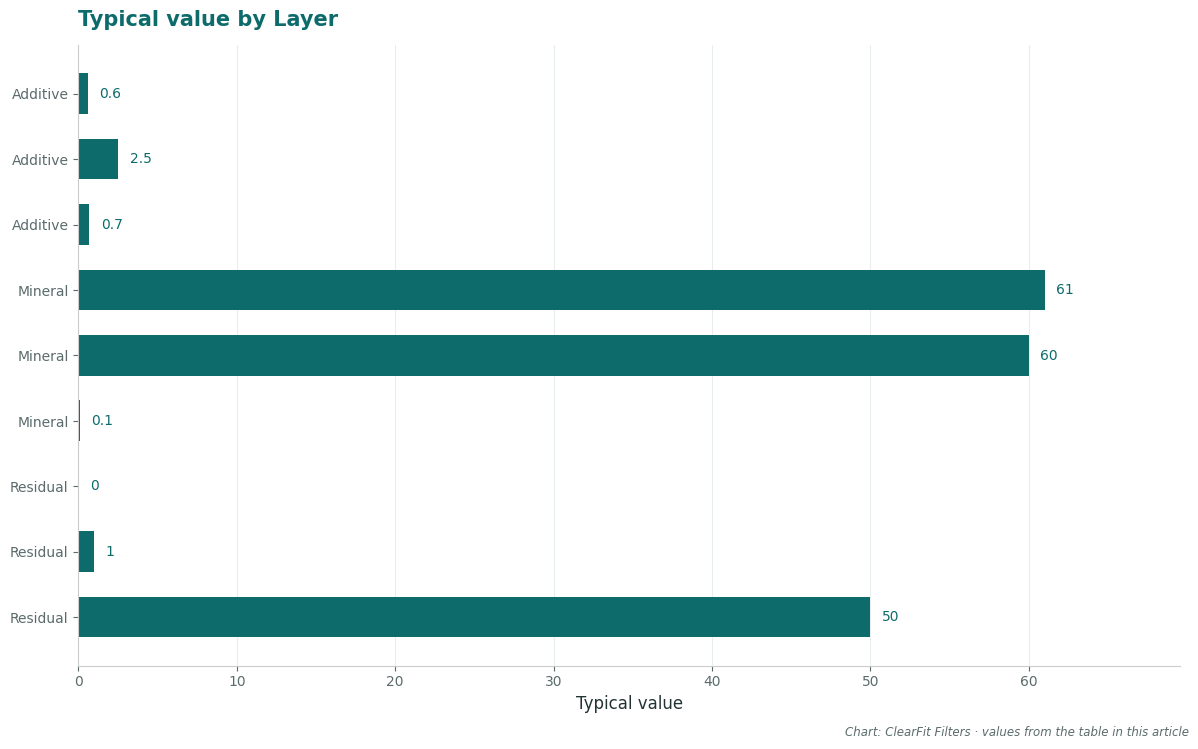
| Layer | Substance | Typical value | Legal line | Note |
|---|---|---|---|---|
| Additive | Chlorine residual | 0.2–1 mg/L at tap | MRDL 4 mg/L | Taste threshold ~0.5–1 mg/L for most noses |
| Additive | Chloramine residual | 1–4 mg/L | MRDL 4 mg/L | Used by ~1 in 5 US utilities; harder to boil out |
| Additive | Fluoride | 0.7 mg/L (where added) | MCL 4 mg/L | ~72% of US population on fluoridated systems |
| Mineral | Hardness (as CaCO₃) | ~61 mg/L national median | None (secondary: taste/scale) | Local range 0–1,000+; USGS maps it |
| Mineral | Sodium | 20–100 mg/L typical | None federal (advisory 20 mg/L for very-low-sodium diets) | Softeners add more — see hard-water pages |
| Mineral | Iron / manganese | <0.1 / <0.05 mg/L treated | Secondary 0.3 / 0.05 mg/L | Stains and taste before health |
| Residual | Lead | 0 to 15 µg/L (90th pct) | Action level 15 µg/L; goal = 0 | Comes from building plumbing, not the plant |
| Residual | Nitrate | <1 mg/L typical | MCL 10 mg/L | Agricultural areas watch item; infants |
| Residual | TTHM / HAA5 | 20–80 / 10–40 µg/L | MCL 80 / 60 µg/L | Disinfection byproducts; peak in warm months |
| Residual | PFAS (PFOA/PFOS) | nd–single-digit ng/L | MCL 4 ng/L each (2024) | Now federally regulated with monitoring phased in |
The forum behavior around this question is split down the middle, and the split is informative. r/AskAnAmerican threads about “why does my water taste different in each city” are really hardness-and-chlorine threads — mineral fingerprints and disinfectant choices, the benign layers. r/BuyItForLife threads about “should I test my tap water” are plumbing-history threads — lead and service lines, the residual layer. Same question (“what’s in my water”), two completely different substance classes, which is the case for learning the three-layer model instead of memorizing chemical names.
Layer 1: The Additives You Can Smell

Disinfectant residual is the reason tap water isn’t 1890s water: utilities maintain a residual all the way to your faucet so the distribution grid stays microbiologically controlled. Chlorine is the classic (detectable by most people around 0.5–1 mg/L — your nose is a functioning chlorine sensor); chloramine (chlorine + ammonia) lasts longer in long mains and produces fewer regulated byproducts, which is why roughly a fifth of US utilities use it. The residual is also the layer easiest to change at your sink: an NSF 42 carbon filter strips it for taste in seconds (the chemistry and boil-vs-carbon comparison live in the chlorine page).
Fluoride at 0.7 mg/L is the public-health additive — the concentration recommended by HHS for dental benefit, present for about 72% of the US population served by community systems. It’s regulated under an MCL of 4 mg/L (skeletal fluorosis at chronic high doses) and a secondary standard of 2 mg/L (cosmetic mottling in children). Whatever position a reader takes on the policy, the dosing fact belongs in this table: it’s added or absent at your utility’s documented level, listed in your CCR.
Layer 2: The Minerals Your Geography Chose
Source geology, not policy, sets this layer. Hardness — dissolved calcium and magnesium — runs a national median near 61 mg/L as CaCO₃ but spans from rain-fed reservoir systems near 10 mg/L to limestone and dolomite aquifers above 300 mg/L (USGS’s hardness map tracks the bedrock). Hardness is the layer you can see: scale on kettles, spots on glassware, the white film a humidifier makes — the cleaning-and-appliance consequences have their own pages (removal, testing). Sodium runs 20–100 mg/L in most supplies (higher in coastal or road-salt-affected areas), and iron and manganese are the stain-and-taste minerals utilities keep under secondary standards — 0.3 and 0.05 mg/L — set for aesthetics, not health.
Layer 3: The Regulated Residuals
Treatment gets contaminants down, and the law defines how far down is far enough — the MCL. The residuals that matter to a national audience:
Lead — the one that isn’t in the water at all when it leaves most plants; it enters in service lines, lead solder (pre-1986), and older brass. The 15 µg/L “action level” is a 90th-percentile compliance statistic, not a safe-exposure line (EPA and CDC both state no safe level; the MCLG is zero). Whether your glass has any is a building question — the audit lives on the lead-pipe page.
Nitrate (MCL 10 mg/L) — agricultural runoff’s signature; above the line it’s an acute risk for infants (blue baby syndrome), which is why well owners near farming test annually — the well-water page.
Disinfection byproducts (TTHM 80 µg/L, HAA5 60 µg/L) — formed when disinfectant meets organic matter; warm-month peaks and a chlorine-taste cousin. Carbon filtration addresses them.
PFAS — the newest federal chapter: April 2024 national primary standards set MCLs of 4 ng/L for PFOA and PFOS (with limits on four more compounds and a hazard-index approach for mixtures), with monitoring phased through 2027 and treatment through 2029. The “forever chemicals” profile and removal options (RO, certified carbon) live in the PFAS entry.
The Two Exceptions People Should Know
One is a genuine safety rule: nasal rinsing (neti pots) and CPAP humidifier chambers should use distilled, sterile, or previously boiled water — not straight tap. The reason isn’t chemistry, it’s rare biology: Naegleria fowleri and other opportunists, harmless swallowed (stomach acid handles them), are dangerous forced up the nose. CDC states this plainly on its neti-pot guidance; it belongs in every honest “what’s in tap water” answer.
The other is an expectations rule: your annual CCR reports the plant and system numbers, but it cannot report your building’s contribution — lead pipes, old solder, stagnation. The CCR plus a building audit is the complete picture (the method is on the CCR guide and the city three-step check).
FAQ
Is tap water 100% safe?
No water is “100% safe” in an absolute sense — tap water is compliant, meaning regulated substances sit under enforceable limits, with pathogens controlled through treatment and residual. Compliance still tolerates nonzero levels of some substances (byproducts, trace lead at the system level), and your building’s plumbing is outside the utility’s report. That’s the distinction between “meets the standard” and “zero risk” — the CCR numbers let you read the gap yourself.
What toxins are found in tap water?
The regulated list runs to ~90 substances: microbial (coliform, giardia, viruses), inorganics (lead, arsenic, nitrate, copper, chromium-6), disinfection byproducts (TTHM, HAA5), organics (benzene, atrazine, vinyl chloride), radionuclides (radium, uranium), and since 2024 six PFAS compounds. “Toxin” does heavy rhetorical lifting — the informative question is which at what concentration versus which limit, all listed in your CCR.
What bacteria in water cause diarrhea?
The classic waterborne bacterial causes: E. coli (pathogenic strains), Campylobacter, Salmonella, Shigella, and Vibrio cholerae where it occurs; protozoal offenders Giardia and Cryptosporidium cause prolonged diarrhea and are the reason surface-water systems filter. US systems test for indicator organisms (total coliform, E. coli) continuously — the 1993 Milwaukee cryptosporidium outbreak (~400,000 ill) is the historical case that reshaped treatment rules.
What is the unhealthiest water to drink?
Unambiguous answers only: untreated surface water you scooped yourself (pathogens), dehumidifier water (biological and metal contamination), and water from containers of unknown history (chemical leaching). Among legal municipal supplies, “unhealthiest” collapses into specific exceedances — lead service lines with stagnation, or PFAS above the new MCLs — which are property-specific findings, not city rankings.
Sources & References
- EPA — National Primary Drinking Water Regulations — MCLs/MRDLs for chlorine (4 mg/L), fluoride (4/2 mg/L), nitrate (10 mg/L), TTHM/HAA5 (80/60 µg/L), lead action level (15 µg/L, 90th percentile). Official documentation.
- USGS — hardness distribution and water-use data — national median ~61 mg/L as CaCO₃. Official documentation.
- CDC — Community Water Fluoridation / neti pot guidance — 0.7 mg/L recommendation; ~72% coverage; distilled-or-boiled nasal rinsing rule. Official documentation.
- EPA — April 2024 PFAS NPDWR — PFOA/PFOS MCLs 4 ng/L; 2027 monitoring / 2029 treatment milestones. Official documentation.
- CDC/EPA — Milwaukee 1993 cryptosporidiosis outbreak record — treatment-rule historical driver. Official documentation.
Related Guides
- Is Tap Water Safe to Drink? — the safety framework around these contents.
- How to Read Your Water Quality Report — finding all of this in your own copy.