How to Read Your Water Quality Report (CCR): A Line-by-Line Walkthrough

Your Consumer Confidence Report arrives every July 1, runs 6–10 pages, and is skimmed by almost everyone who receives it — because the three tables that matter are buried under brochure prose. This page does what no regulator page does: a simulated CCR, annotated line by line, including the three columns that consistently confuse readers (90th percentile, RAA, and the difference between MCL and MCLG — the gap where the real story lives). Related: Is Tap Water Safe to Drink? and How to Test Water Quality at Home.
Quick Answer: Your CCR is due by July 1 each year. Read three tables: Detected Contaminants (compare “Level Found” against MCL and MCLG), Violations, and Source. The number most readers miss: where MCL and MCLG diverge — that gap is the legally-acceptable-but-not-health-ideal band, and it’s the honest answer to “is my water good?”
| CCR line | What it means | Red flag |
|---|---|---|
| MCL | Enforceable limit (tech + cost adjusted) | Level Found > MCL = violation |
| MCLG | Health goal, often 0 for carcinogens | Level Found near MCL with MCLG = 0 |
| 90th percentile (lead/copper) | 9 of 10 sampled taps were below this | ≥15 ppb lead = action level exceedance |
| RAA | Running annual average (byproducts) | Single bad quarters can hide in it |
| TT | Treatment technique (in lieu of MCL) | Any TT violation = take seriously |
| Range | Min–max across the year’s samples | Max far above average = seasonal events |
The user behavior around CCRs is consistent across Reddit threads in r/water and r/homeimprovement: someone photographs page 4 of the PDF, posts it, and asks “is this bad?” The recurring confusion is always the same two rows — lead’s “90th percentile: 7 ppb” (is 7 bad? compared to what?) and disinfection byproducts showing a big range (spring vs fall). The annotations below answer exactly those two rows first.
The Annotated Sample: One System, Six Rows Decoded

Below is a composite of a real mid-size system’s detected-contaminants table (values typical, structure identical across nearly all CCRs):
| Contaminant | Level Found | MCL | MCLG | Range | Violation |
|---|---|---|---|---|---|
| Lead (90th %ile) | 4.7 ppb | AL 15 | 0 | n/a | No |
| Nitrate | 2.1 ppm | 10 | 10 | 1.4–2.1 | No |
| Total trihalomethanes | 42 ppb | 80 | 0 | 18–61 | No |
| Arsenic | 3.2 ppb | 10 | 0 | 2.5–3.2 | No |
| Copper (90th %ile) | 0.4 ppm | AL 1.3 | 1.3 | n/a | No |
| Chlorine | 0.8 ppm | MRDL 4 | MRDL 4 | 0.4–1.1 | No |
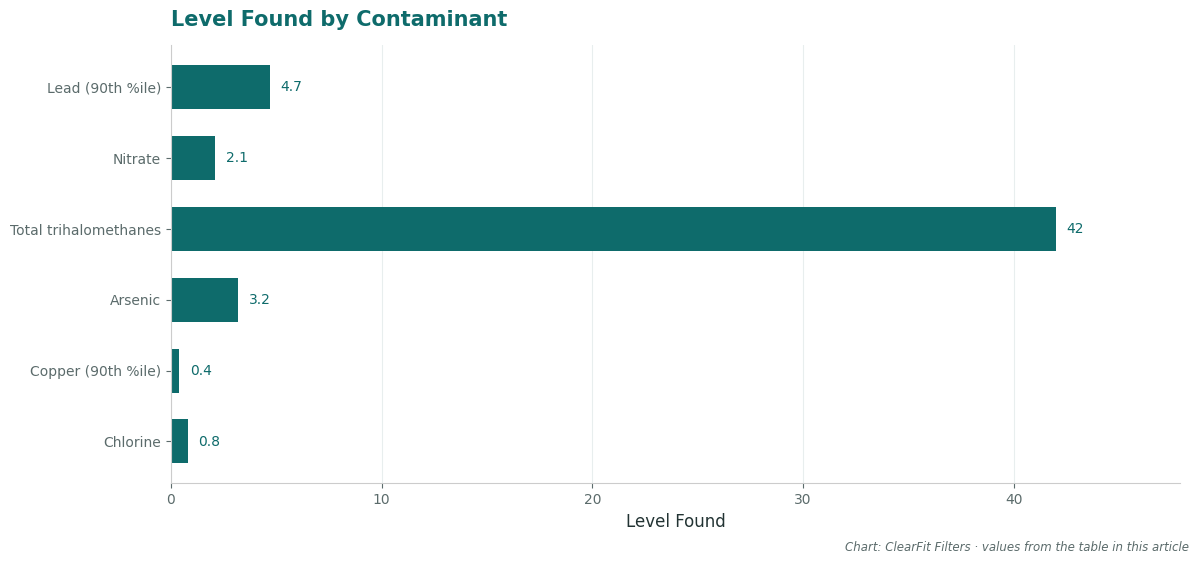
Row 1 — Lead: read the MCLG, not just the action level. “4.7 ppb, no violation” is legally true and fully compliant. But the MCLG for lead is zero — there is no safe level in EPA’s health framework, only an enforcement trigger at 15 ppb (at the 90th percentile of sampled taps). Any nonzero lead row means lead is entering water somewhere between the main and the tap. Whether 4.7 ppb warrants a NSF 53 filter is a household-by-household call — pregnancy and infants lower most people’s threshold. (Whether you have lead plumbing at all: the 60-second check.)
Row 2 — Nitrate: the one with no slack. Nitrate’s MCL equals its MCLG (10 ppm) — no cost-adjusted compromise, because the infant-methemoglobinemia risk is acute. A nitrate row anywhere near 8–9 ppm deserves attention for formula-feeding households; RO or ion exchange is the standard response.
Row 3 — TTHMs: the range tells the story. The annual average (RAA) of 42 ppb is compliant; the max of 61 shows warm-season peaks when organic matter in source water spikes. If your row’s max is near 80, buy filtered water in late summer for the at-risk household members rather than trusting the average.
Rows 4–6: arsenic (a carcinogen with MCLG 0, enforcement at 10 — same “two rulers” logic as lead), copper (1.3 action level; blue-green stains under 1.3 are still worth reading — see pH and corrosion), and chlorine (the residual protecting you in the pipes; its absence would be the alarming reading).
MCL vs MCLG: Why “Compliant” Can Still Mean “Improvable”
EPA sets two numbers per contaminant. The MCLG is the pure health goal — for known carcinogens with no safe threshold, it is zero. The MCL is the enforceable limit, set as close to the goal as “feasible” with current treatment technology and cost accounting — a legislative compromise written into the Safe Drinking Water Act framework.
So when your CCR shows arsenic at 3.2 with MCL 10, both facts hold: the system is legally clean, and a health-ideal would be lower. This is not a scandal — it is the documented structure of the standard — but it is the single most useful thing a CCR reader can understand, because it converts “is my water safe?” from a yes/no into a graduated question you can actually act on. (The same two-ruler logic, applied at the national level, is in our tap-water overview.)
Units Cheat Sheet (ppm, ppb, and One Helpful Analogy)
1 ppm = 1 mg/L. 1 ppb = 1 µg/L. 1 ppm = 1,000 ppb. CCRs print both because regulations quote both.
For scale: 1 ppb is one second in 32 years, or one drop of water in an Olympic-sized swimming pool (~660,000 gallons). EPA’s arsenic limit of 10 ppb is, by mass, about 10 drops in that pool — which is simultaneously “trace” and, over two liters a day for decades, a legitimate regulatory concern. Both intuitions are correct; contaminant standards live in exactly that tension.
Well Water: The Report You Don’t Get
CCR rules cover community systems only. Private wells (~13% of US households) receive no report, ever — the testing is entirely the owner’s job, and the annual panel EPA recommends for wells (total coliform, nitrate, plus local-suspect contaminants like arsenic) runs $150–300 at a certified lab. That testing path — what to order, how to sample, and the first-draw protocol for lead — is the full topic of How to Test Water Quality at Home.
From Finding to Fix
A CCR finding becomes an action through one mapping: chlorine/THM taste → NSF 42 carbon; lead or arsenic confirmed at the tap → NSF 53 (or RO for arsenic, nitrate, and TTHM reduction); nitrate near the limit for a formula household → RO or bottled. The certification system — what NSF 42 vs 53 actually promise — is detailed in NSF 42 vs NSF 53.
FAQ
How do I interpret the results of a water quality test?
Compare every “level found” against both limits printed beside it: the MCL (legal) and MCLG (health goal). Under MCL with MCLG equal to it (like nitrate) is as clean as the standard gets; under MCL with MCLG of zero (lead, arsenic, byproducts) means compliant with remaining theoretical risk you may choose to filter.
How do I read my water quality report?
Go straight to three tables — Detected Contaminants, Violations, and Source — and skip the brochure pages. In the contaminants table, read right to left: violation column first, then compare Level Found to MCL and MCLG. Total time: about five minutes.
What is a good water quality score?
There is no single score — a CCR is pass/fail per contaminant plus concentrations. A “good” report means zero violations, all levels well under MCLs, and lead/copper 90th-percentile values in the low single digits or undetected.
What is good TDS for drinking water?
EPA’s secondary (aesthetic) guideline is under 500 mg/L; most US tap water runs 50–300 mg/L. TDS is a taste and scaling indicator, not a safety measure — it tells you nothing about lead, bacteria, or PFAS, which is the key trap in cheap water testing.
Sources & References
- EPA — Consumer Confidence Report Rule (delivery by July 1; required content); National Primary Drinking Water Regulations (MCL/MCLG values cited). Official documentation.
- Safe Drinking Water Act framework — MCL set “as close to MCLG as feasible” language. Official regulation.
- EPA Lead and Copper Rule — 15 ppb action level at 90th percentile; MCLG 0. Official documentation.
- EPA Secondary Standards — TDS 500 mg/L guideline. Official documentation.
- Reddit r/water, r/homeimprovement — recurring CCR-photo help requests; confusion patterns referenced. Community discussion.
Related Guides
- How to Test Water Quality at Home — when the CCR isn’t enough.
- Is Tap Water Safe to Drink in the US? — the national picture behind your local table.
- NSF 42 vs NSF 53 Certification — what filter labels actually certify.
Full entry: Lead in water – the full entry
Related deep dive: Where Does Drinking Water Come From?