What Is PM2.5? The Particle Science (Including the 2024 Standard Most Pages Still Miss)

PM2.5 is particulate matter 2.5 micrometers and smaller — roughly 1/30th the width of a human hair — and the size is precisely the danger: particles that fine defeat the airway’s clearance machinery and deposit deep in the lungs, with the smallest fraction crossing into the bloodstream. The regulatory number just moved: EPA tightened the annual standard to 9 µg/m³ in 2024 (from 12), and many explainer pages still carry the old figure. Here: the size ladder, the deposition mechanism, both standards (EPA and WHO), and the filtration physics that connects this word to your filter slot. Related: What Is AQI?.
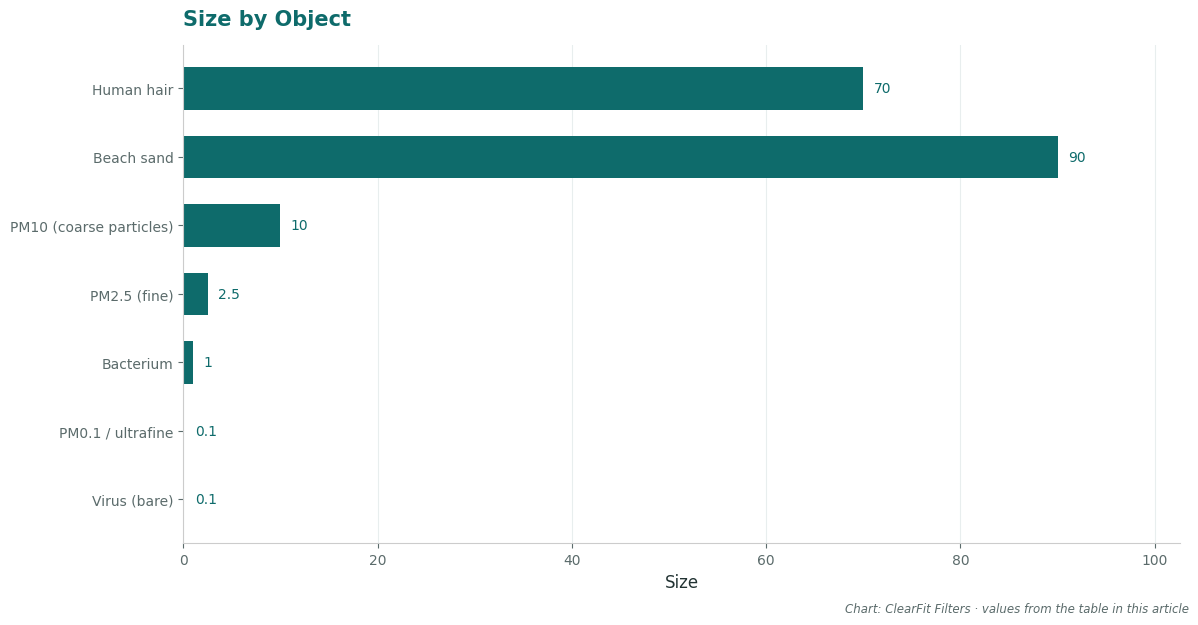
Quick Answer: PM2.5 is particulate matter ≤ 2.5 micrometers — ~1/30th a human hair’s width (70 µm). The size is the hazard: below ~2.5 µm, particles evade the airways’ clearance defenses and lodge deep in the lungs, with the finest fraction entering circulation. EPA’s 2024 annual standard is 9 µg/m³ (down from 12); WHO’s guideline is 5.
| Object | Size |
|---|---|
| Human hair | ~70 µm |
| Beach sand | 90 µm+ |
| PM10 (coarse particles) | ≤ 10 µm |
| PM2.5 (fine) | ≤ 2.5 µm |
| Bacterium | ~1 µm |
| PM0.1 / ultrafine | ≤ 0.1 µm |
| Virus (bare) | ~0.1 µm |
The question thread under every PM2.5 explainer, most reliably from r/airpurifiers buyers: “if it’s so small, how does any filter catch it — don’t filters work like sieves?” The answer is the single best physics fact on this page: mechanical filters don’t sieve; they intercept, impact, and diffuse — and below ~0.3 µm, diffusion (Brownian walk into a fiber) gets more effective as particles get smaller. The full mechanism maps to the MERV scale below.
Why Size Is the Hazard: The Deposition Mechanism

Your airway clears inhaled particles by three escalating defenses: nasal hairs and bends (efficient above ~10 µm), mucociliary escalation — mucus escalator up the bronchi (efficient 2.5–10 µm) — and macrophage patrol in the deep lung (slow, imperfect). PM2.5 slips through all three: small enough to follow airflow into the alveolar region, where no cilia exist and clearance depends on immune cells that handle a fraction of the load. From the alveoli, the finest particles (and soluble compounds on them) pass into the bloodstream — the cardiovascular pathway — which is why the epidemiology of PM2.5 reads as much in heart attacks and strokes as in asthma.
That’s the mechanism behind the epidemiological dose-response — and why there is no documented threshold below which PM2.5 is inert: standards are risk-management lines drawn on a continuous curve, not a cliff edge (the AQI translation of concentrations: the AQI page).
The Two Standards (One of Which Moved in 2024)
EPA, February 2024: annual PM2.5 NAAQS tightened from 12.0 to 9.0 µg/m³ — the first tightening since 2012, projected by EPA to prevent thousands of premature deaths annually; the 24-hour standard held at 35 µg/m³. The AQI “Good” band ceiling moved to 9.0 µg/m³ accordingly.
WHO, 2021 Air Quality Guidelines: annual 5 µg/m³, 24-hour 15 µg/m³ — the strictest evidence-synthesized targets globally, set by panel review of the cohort literature (no feasible-adjustment compromise built in; many countries run several multiples above them).
The honest reading: much of the continental US sits in the 6–10 µg/m³ annual range — compliant with the new EPA standard, above the WHO guideline. The gap between the two rulers is where most app-vs-app confusion comes from; the two-column table on the AQI page resolves it.
Indoors vs Outdoors: The Ratio That Decides Your Strategy

Without any filtration and with normal ventilation, indoor PM2.5 tracks outdoor at roughly 50–70% (infiltration factor from typical US housing stock), plus whatever you generate indoors — cooking (a hot sear can spike a kitchen past 200 µg/m³ for minutes), candles, smoking, and in winter, wood stoves. With windows closed and a MERV 13+ system or portable HEPA running, the ratio drops toward 20% or below of outdoor during smoke events (the sealing-and-filtering account).
The practical inversion: on bad-air days, indoor-with-filtration is the strategy; on ordinary days, the largest indoor PM2.5 source in most homes is their own kitchen — range-hood use (vented outside, not recirculating) is the single most effective habit.
The MERV Bridge: Why PM2.5 Is Written Into Filter Ratings
The MERV scale’s three test bands are particle-size bands — E1 (0.3–1 µm), E2 (1–3 µm), E3 (3–10 µm) — and PM2.5 straddles E1 and E2. A MERV 8 filter is rated on E3 only (no submicron claim); a MERV 11 begins E1 coverage (≥20%); a MERV 13 posts ≥50% E1 capture — the EPA-recommended minimum for wildfire smoke and respiratory-health upgrades (MERV 13 options; the full rating mechanics: MERV Rating Explained).
And the counterintuitive footnote from filter physics: the most-penetrating particle size is ~0.1–0.3 µm — the awkward middle where diffusion hasn’t gotten strong and particles are still too small to intercept — so a filter’s 0.3 µm rating is close to its worst case, with both smaller and larger particles captured at higher rates. This is why HEPA is certified at 0.3 µm: it’s the hardest question on the test.
FAQ
What PM2.5 level is safe?
No level is documented as fully inert — risk declines continuously as concentration falls. Operational anchors: EPA annual standard 9 µg/m³, WHO annual guideline 5, EPA 24-hour 35 µg/m³. For daily decisions, the AQI translation: under 9.0 is “Good,” 9–35 “Moderate,” above 35.5 µg/m³ begins the sensitive-group caution band.
Can PM 2.5 be removed from the body?
Partially, slowly, and incompletely. Coarse-diesel-era thinking doesn’t apply: the deep-lung fraction clears via macrophages over weeks to months, and the ultrafine fraction that crosses into circulation or deposits in other organs clears slower still. The practical implication runs the other way — prevention (filtration, timing, masks) dominates because removal is the body’s slow, lossy process.
Is PM 2.5 worse than smoking?
Different dose curves — but by the Berkeley Earth mass equivalence, a day at ~22 µg/m³ ≈ one cigarette’s PM2.5 exposure, so a week of AQI 150 smoke days (~44 µg/m³) ≈ 14 cigarettes. Heavy smoking (a pack a day) delivers ~20 cigarettes daily plus direct lung deposition — smoking is still categorically worse for a smoker; chronic ambient PM2.5 is the population-scale exposure.
What is PM 2.5 and why is it so harmful?
PM2.5 is the mass concentration of particles ≤2.5 µm per cubic meter of air. The harm mechanism is the size: sub-2.5 µm particles bypass nasal and mucociliary clearance, deposit in the alveolar region, and the finest fraction enters the bloodstream — driving the cardiovascular and respiratory outcomes in the epidemiological literature.
What’s the difference between PM10 and PM2.5?
Size and where each deposits. PM10 (≤10 µm, “coarse”) is mostly dust, pollen fragments, and road grit — the airway’s first two defenses (nasal filtering, mucociliary escalator) catch most of it, so its health signal is irritation and asthma aggravation. PM2.5 (≤2.5 µm, “fine”) defeats all three clearance layers and reaches the alveoli and bloodstream, which is why its epidemiology is cardiovascular as well as respiratory. On safe levels: the two share the AQI’s pollutant list but carry separate breakpoints — EPA’s PM2.5 annual standard is 9 µg/m³ (2024), the PM10 24-hour standard is 150 µg/m³; when apps report “PM2.5 and PM10” together, the PM2.5 sub-index is almost always the one driving a bad AQI. (The AQI selection math: What Is AQI?.)
What is TVOC in air quality readings?
TVOC — total volatile organic compounds — is the gas-phase sum that cheap air-quality monitors report alongside PM2.5, and the distinction matters for what you do about it: TVOC is not particles at all. It’s the combined concentration of airborne organic gases (formaldehyde/HCHO among them — the “hcho and tvoc” pairing on monitor screens), off-gassed by paint, furniture, adhesives, and cleaners. A MERV 13 filter, whatever it does for PM2.5, does nothing for TVOC by physical design — particle filters can’t capture gases; activated carbon is the household technology that does (the full off-gassing timeline and sensor-accuracy caveats: VOCs in Your Home Air). One more calibration note: consumer TVOC “air quality” readings are relative and sensor-dependent — use them to track trends (spike after new furniture? decay over weeks?) rather than as absolute safety numbers.
Sources & References
- EPA (2024 final rule) — PM NAAQS annual 9.0 µg/m³, 24-h 35; AQI Good-band realignment. Official documentation.
- WHO (2021) Air Quality Guidelines — annual 5 / 24-h 15 µg/m³ and derivation. Official documentation.
- Particle-deposition and mucociliary-clearance literature — size-selective deposition physics. Peer-reviewed research.
- ASHRAE 52.2 / MERV test bands (E1/E2/E3) — rating mechanics. Official standard.
- Berkeley Earth — cigarette equivalence for the FAQ. Industry expert analysis.
- Reddit r/airpurifiers — “how does a filter catch it” buyer question. Community discussion.
Related Guides
- What Is AQI and How to Read It — the index built on this pollutant.
- How Wildfire Smoke Gets Indoors — the event playbook.
- MERV Rating Explained — what filter ratings promise against these sizes.